
How Is Boron Removed in SWRO Systems? A Membrane and Second Pass Guide to Boron Removal from Seawater
Ekim 9, 2026
Deniz Suyu Arıtma Sistemlerinde Çalışma Prensibi, Maliyet ve Seçim
Ekim 22, 2026SWRO energy consumption is calculated by dividing electricity used during a defined period by the usable water produced during that period. A reliable result requires matching measurement boundaries, timestamps and water quality requirements. Measuring only the high-pressure pump gives a different answer from measuring the complete installation, including intake, pretreatment, flushing and product transfer.
For Reinmeer Water Treatment Systems, meaningful energy assessment starts with feedwater analysis, required output and operating conditions. Two installations with identical rated capacities can have different electricity costs because salinity, temperature and operating schedules differ. The objective is a verifiable calculation that supports equipment selection, budgeting and performance monitoring.
How to Calculate SWRO Energy Consumption and Electricity Costs
Specific energy consumption = electrical energy used (kWh) / usable product water (m³). This indicator, usually abbreviated SEC, expresses energy intensity. Power in kW describes an instantaneous load; energy in kWh accumulates over time. For constant operation, multiply average electrical power by running hours. With varying loads, use integrated meter readings.
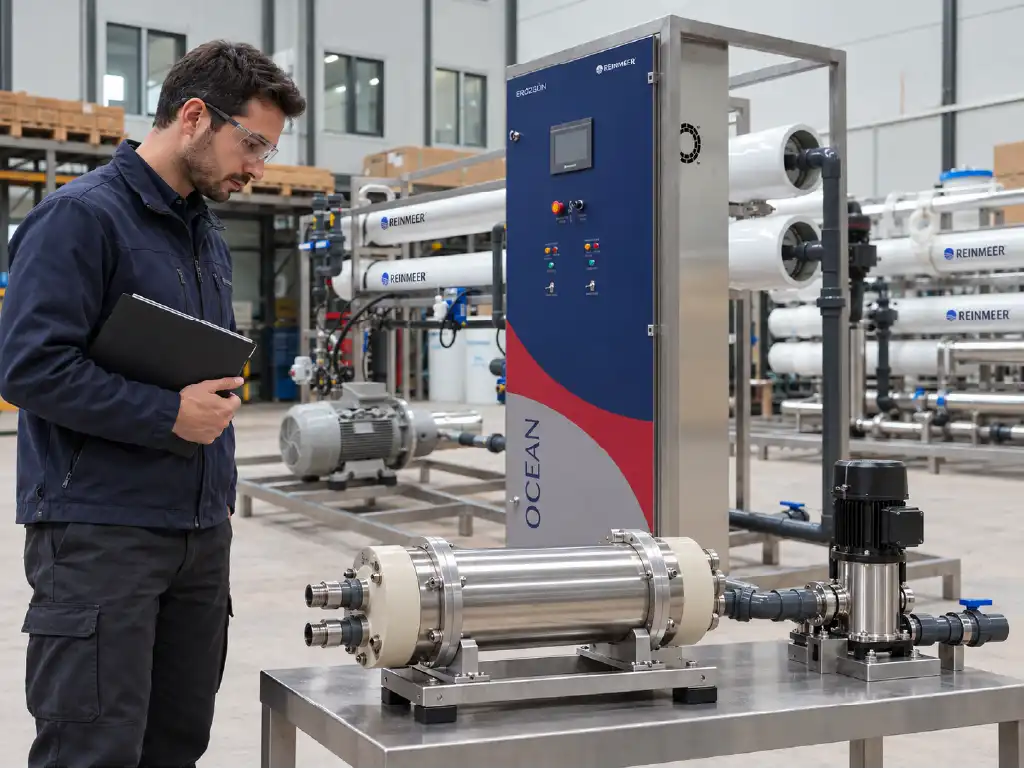
Suppose a plant consumes 360 kWh daily and delivers 100 m³ of compliant, usable water. Its SWRO energy consumption is 3.60 kWh/m³. The denominator is product water, rather than seawater intake. Off-specification permeate diverted during startup must be excluded. Product water consumed internally also needs consistent treatment under the agreed net production definition.
The following example assumes an electricity price of USD 0.15/kWh. It demonstrates the calculation and is neither a current tariff nor a commercial quotation. Actual seawater desalination energy cost depends on the electricity contract and applicable billing components.
| Indicator | Example value | Calculation |
|---|---|---|
| Specific consumption | 3.60 kWh/m³ | 360 / 100 |
| Electricity cost | USD 0.54/m³ | 3.60 × 0.15 |
| Monthly usable output | 3,000 m³ | 100 × 30 days |
| Monthly electricity cost | USD 1,620 | 3,000 × 0.54 |
Electricity is only one operating expense. Chemicals, consumables, membrane replacement allowances, maintenance, labour, testing and concentrate management require separate entries. If these other expenses total an illustrative USD 0.26/m³, combined operating expenditure becomes USD 0.80/m³. Adding depreciation and financing produces a broader water production cost rather than operating expenditure alone.
Under time-of-use tariffs, calculate each period using its applicable rate. Allocate demand charges and other relevant costs transparently. Monthly SEC equals total monthly kWh divided by total monthly usable cubic metres. Averaging daily SEC values without weighting by production can distort the result, particularly when low-output days include substantial standby consumption.
Budget sensitivity also matters. A 20% tariff increase raises the energy expense by 20% at unchanged output and electricity use, but does not change SWRO energy consumption. Production losses can instead increase unit water cost without any tariff change. Keeping these effects separate helps technical and purchasing teams interpret the same records correctly.
Which Equipment Consumes Energy in an SWRO System?
SWRO energy consumption must be reported against an explicit system boundary. A membrane-skid value cannot be compared directly with a complete facility value. The US Department of Energy’s seawater desalination energy study distinguishes intake, pretreatment, desalination, post-treatment and concentrate management when assessing energy use.
The High-Pressure Pump’s Contribution to Total Consumption
The high-pressure pump supplies the pressure needed for membrane separation and is commonly a major electricity consumer. Required pressure changes with salinity, temperature, membrane characteristics, recovery and product flow. Motor nameplate power describes equipment rating; it does not establish actual electrical input at every operating point.
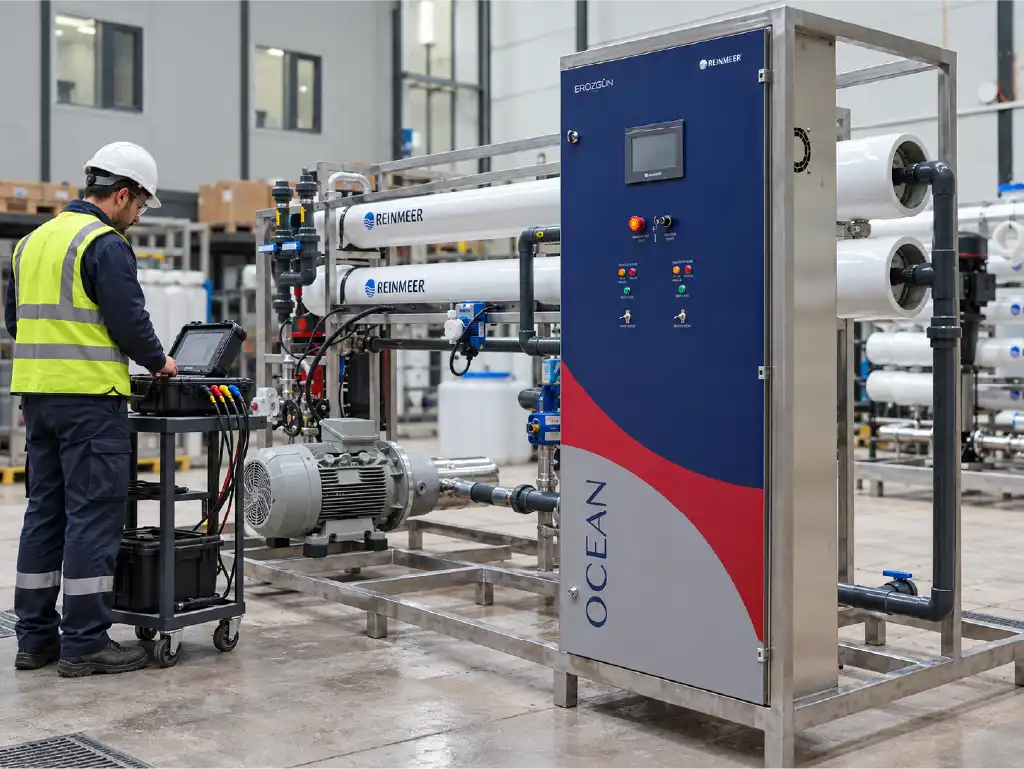
A preliminary estimate is P = Q × Δp / (36 × ηpump × ηmotor × ηdrive). Here, P is electrical input in kW, Q is flow through that pump in m³/h, and Δp is its pressure increase in bar. Efficiencies are decimal fractions. Use 1 for drive efficiency when no drive is fitted.
How Should the High-Pressure Pump’s Contribution Be Evaluated Technically?
Consider a separate example without an energy recovery device: flow is 10 m³/h, pressure increase is 60 bar, and pump, motor and drive efficiencies are 0.80, 0.95 and 0.97. Estimated electrical input is 22.61 kW. At 4 m³/h product flow, the pump alone contributes approximately 5.65 kWh/m³. This is a different scenario from the earlier whole-plant example.
With an isobaric ERD, high-pressure pump flow may differ from total membrane feed flow. Calculate each pump using its own hydraulic duty. If measured electricity already reflects energy recovery, do not subtract a theoretical recovered-energy quantity again. That would count the benefit twice and understate SWRO energy consumption.
Measurement Methods, Records and Acceptance Criteria
Use true three-phase active energy measurements, calibrated flowmeters and synchronized pressure records. Current alone is insufficient to determine electrical input. Align meter and automation timestamps, then record feed temperature, conductivity, product flow, operating hours and shutdown causes on the same timeline.
Define test duration, feed conditions, product quality, capacity and included equipment before acceptance testing. Distinguish a steady-state performance test from monthly operational performance. Account for measurement uncertainty. No universal acceptance value applies to every SWRO installation, and a guarantee should state its reference temperature and salinity.
Ask whether second-pass treatment, product transfer and pretreatment are included in a quoted SWRO energy consumption guarantee. Record exclusions explicitly. Comparing the same net-water definition and measurement boundary is more useful than choosing the lowest headline number.
Pretreatment and Auxiliary Equipment Consumption
Intake pumps, media filtration, ultrafiltration where installed, dosing pumps and control equipment all contribute to the balance. Cartridge filters consume no electricity directly, but their pressure losses increase pumping demand. Cleaning systems, compressed air, disinfection and product transfer should be included where they fall inside the declared boundary.
Reducing pretreatment duty indiscriminately can increase membrane fouling and subsequent energy demand. The filtration, automation and monitoring principles described in Reinmeer’s treatment technology approach therefore belong within the same engineering assessment as pump efficiency and membrane performance.
How Should Pretreatment and Auxiliary Consumption Be Evaluated Technically?
For SWRO energy consumption assessment, combine a facility meter with submeters on major loads. When shared equipment supplies other production lines, document the allocation method. Flow-based allocation is appropriate only when pressure and operating conditions justify it. An unexplained percentage does not provide a dependable comparison.
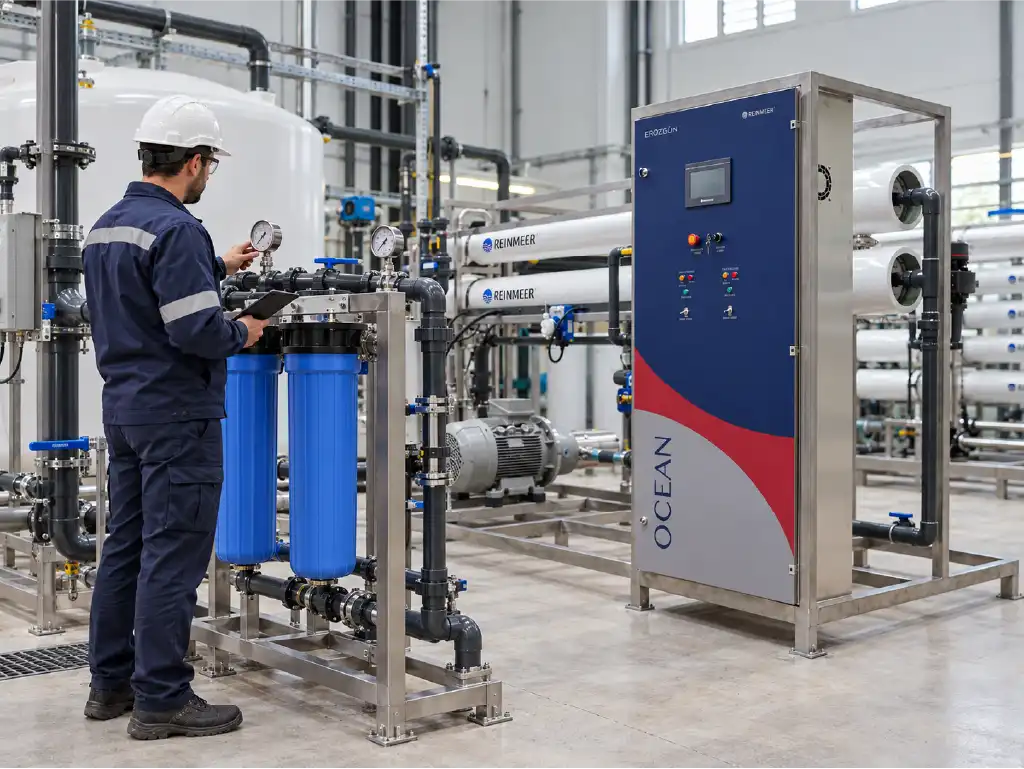
Include intermittent duties over a representative period. Backwashing can consume electricity while drawing product water from storage, affecting both sides of the SEC calculation. Track that consumption consistently without deducting the same water twice. Startup frequency, standby loads and cleaning events should remain identifiable in the operating record.
Risk Indicators, Corrective Actions and Verification
Investigate rising filter differential pressure, frequent backwashing, unstable suction pressure and increasing auxiliary energy at unchanged output. Check instruments first, then inspect filters, valve positions and pump duty. Repeat measurements under comparable conditions after intervention. Seasonal facilities should also review storage capacity and operating schedules to avoid inefficient short production cycles.
How Can Specific Energy Consumption Be Reduced?
Reducing SWRO energy consumption means producing compliant, usable water with less total energy. Lowering instantaneous kW is insufficient if production falls faster. Effective optimization considers energy recovery, membrane duty, hydraulic losses and operating schedules together, while preserving output quality and equipment operating limits.
The Effect of an Energy Recovery Device
The concentrate leaving the membranes retains pressure energy. Depending on the technology, an energy recovery device reuses this through mechanical transfer or direct hydraulic pressure exchange. In an isobaric arrangement, concentrate pressurizes part of the incoming feed. The main pump, booster pump and recovery device must therefore be assessed together.
High device efficiency does not equal the same percentage reduction in facility electricity. Net savings depend on the original design, concentrate flow, pressure losses, mixing and auxiliary pumping. When evaluating Reinmeer seawater reverse osmosis systems, select the energy recovery arrangement against capacity and the complete process configuration.
How Should the Energy Recovery Device’s Effect Be Evaluated Technically?
Compare SWRO energy consumption before and after modification at equivalent production, product quality and feed conditions. Determine net savings from the combined electrical input of all relevant pumps. Record ERD inlet and outlet pressures, flow balance and conductivity changes using the equipment supplier’s performance assessment procedure.
For an illustrative investment, reducing SEC from 4.10 to 3.60 kWh/m³ saves 0.50 kWh/m³. At 30,000 m³ annual usable production and an assumed USD 0.15/kWh, annual electricity savings are USD 2,250. Simple payback equals additional investment divided by annual net savings; maintenance differences, downtime and financing require separate consideration.
Measurement Methods, Records and Acceptance Criteria
Retain the ERD model, operating range, instruments, valve settings and control parameters in the test file. Compare actual conditions before interpreting changes. Acceptance should demonstrate the contracted capacity and water quality together with net energy consumption inside the agreed measurement boundary, rather than relying solely on a component efficiency figure.
Optimizing Recovery, Membranes and Pump Efficiency
Recovery is permeate flow divided by membrane feed flow. Producing 4 m³/h from 10 m³/h feed represents 40% recovery. Raising recovery can reduce raw water intake per product volume, but also increases concentrate salinity and scaling risk. Higher recovery therefore does not automatically reduce SWRO energy consumption.
Membrane selection must balance permeability with salt rejection, boron requirements, flux and fouling tendency. A lower-energy first pass can lose its advantage if additional treatment becomes necessary. Assess any second pass within the same system boundary. Seasonal temperature variation also changes the balance between required pressure, output and product quality.
How Should Recovery, Membranes and Pump Efficiency Be Evaluated Technically?
Evaluate alternative recovery settings and membrane selections using supplier projections and representative feed analyses. Check pump efficiency across the actual operating envelope. Variable-speed control can help, but cannot remove the membrane’s pressure requirement. Minimum flows, pressure ratings and equipment limits still apply; motor efficiency alone does not determine system performance.
The Department of Energy’s pumping performance sourcebook explains why matching pump duty to efficient operating conditions matters. Apply this principle to the complete hydraulic arrangement when reviewing SWRO energy consumption.
Expert note: Do not attribute increasing SEC immediately to membrane failure. Verify temperature, salinity, meter accuracy, leakage and the usable-water definition first. Then assess normalized membrane indicators and pump performance. This sequence helps avoid unnecessary cleaning or premature replacement while the underlying problem remains unresolved.
Risk Indicators, Corrective Actions and Verification
Track normalized differential pressure, normalized permeate flow, salt passage and energy trends together. Follow the membrane supplier’s cleaning instructions. After adjusting recovery or controls, verify product quality, concentrate conditions and total electricity again. An apparent SWRO energy consumption improvement should not be accepted when required water quality deteriorates.
Record the previous settings, intervention and verified result. Changing several parameters simultaneously makes the source of improvement difficult to identify. Controlled comparisons create useful evidence for maintenance planning and help subsequent operators retain the gains.
Frequently Asked Questions
What Is a Good SWRO kWh/m³ Value?
There is no single value suitable for every installation. Compare systems at matching salinity, temperature, output quality and measurement boundaries. A low skid-only figure may exclude important site loads and should not be treated as a whole-facility guarantee.
Can an Electricity Bill Establish SWRO Energy Consumption?
Yes, if its kWh readings cover only the defined plant and corresponding usable production is measured. Shared meters require submetering or justified allocation. Dividing the monetary bill by water output gives electricity cost per cubic metre, not physical energy intensity.
Can an ERD Be Retrofitted to an Existing Plant?
Potentially, following a project-specific review of flows, pressures, pump compatibility, controls, space and piping. The investment decision should consider verified net savings, implementation downtime and the remaining economic life of the installation.
What Should Be Checked When Desalination Electricity Use Rises?
First verify energy readings and net production. Then examine salinity, temperature, pressure losses, membrane indicators and auxiliary duties. Unchanged electricity with declining output also raises SEC, so increased motor loading is not the only possible explanation.
Does a Lower Electricity Bill Prove Better Efficiency?
No. Tariff changes can lower expenditure without reducing SWRO energy consumption. Track kWh/m³ as the technical indicator and currency per cubic metre as the financial indicator. Assess both over matching periods before judging an improvement.
Request a Project-Specific Energy and Operating Cost Assessment
A dependable SWRO energy consumption target requires feedwater data, water quality requirements and operating needs to be assessed together. Discuss a new installation or an existing plant upgrade with Reinmeer Water Treatment Systems through a project-specific technical consultation. Share your daily and hourly water demand, available seawater analysis, intended application, electricity tariff and expected operating schedule to support the initial assessment.
For an existing installation, pump information, a process diagram, meter readings and production records provide a useful starting point. For a new project, pretreatment, membranes, energy recovery and storage can be considered as one system. Explore Reinmeer’s seawater treatment solutions and request clear measurement boundaries, acceptance conditions and cost inclusions. These details make proposals easier to compare, support realistic budgeting and establish an evidence-based basis for tracking performance throughout operation.
Images are illustrative and were created using artificial intelligence.