How to Select an SWRO Intake Structure: Open-Ocean Intake vs. Beach Wells
Ağustos 28, 2026
How Is Boron Removed in SWRO Systems? A Membrane and Second Pass Guide to Boron Removal from Seawater
Ekim 9, 2026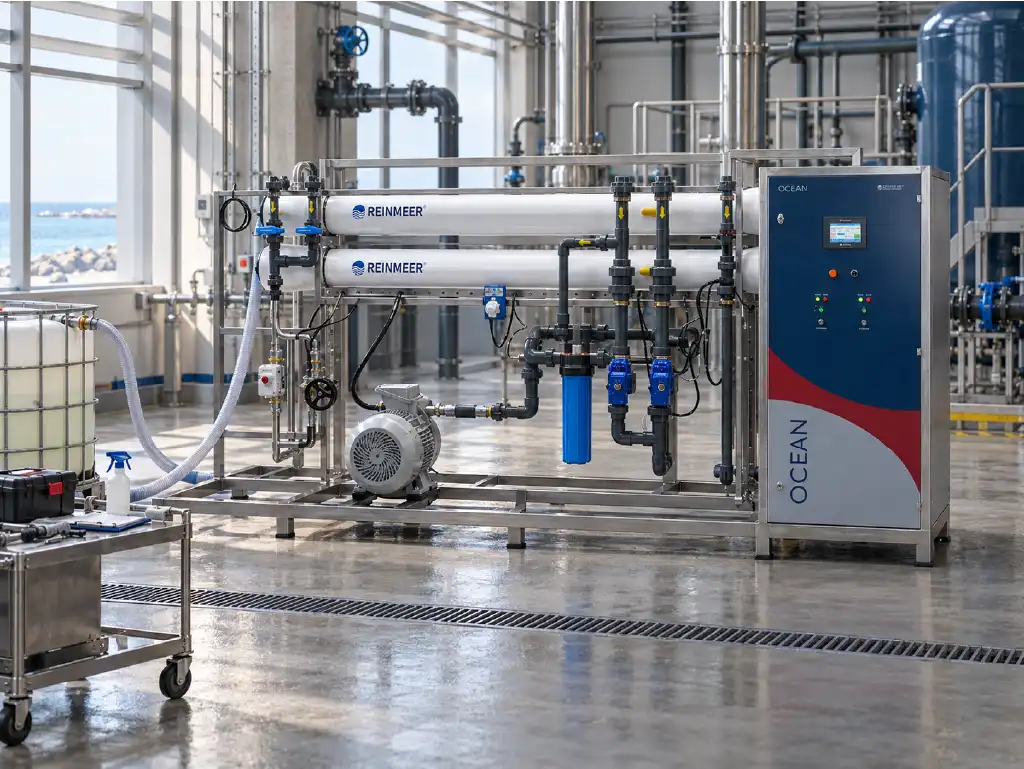
An SWRO membrane CIP decision should be based on normalized performance trends, not simply on a calendar. Typical indicators include an approximately 10% decline in normalized permeate flow from the clean baseline, a 15% increase in normalized pressure drop, or a 10% deterioration in normalized permeate quality or salt passage.
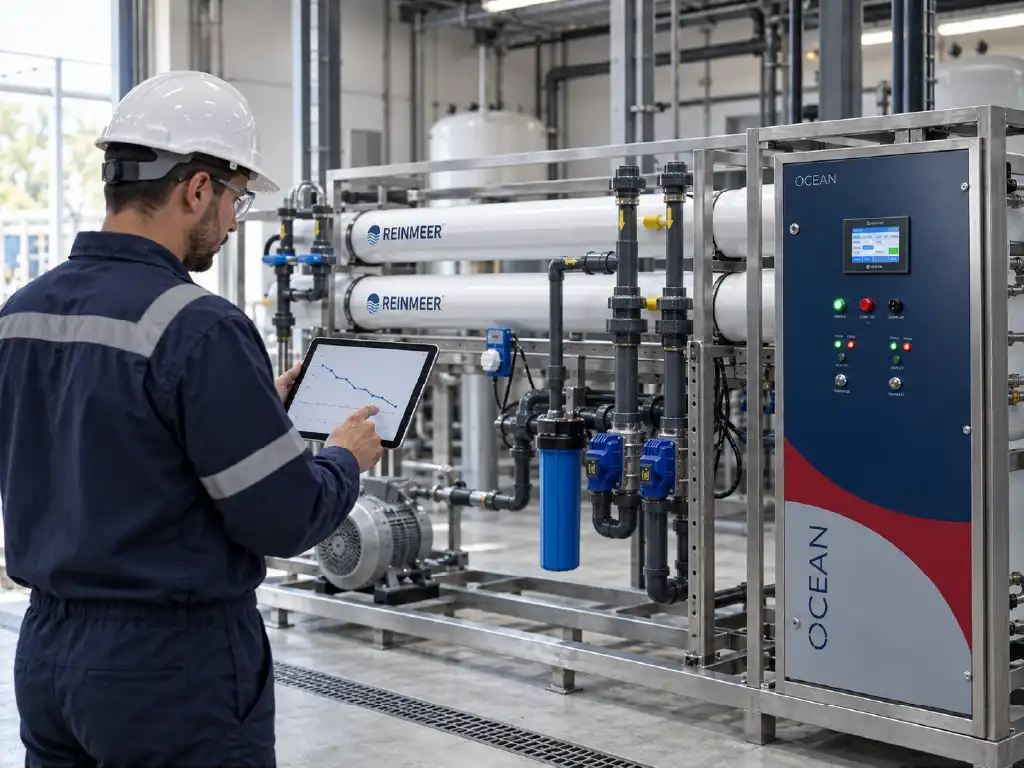
One reading, however, is not enough to start cleaning. Seawater temperature, feed salinity, recovery, permeate backpressure and instrument accuracy can all change raw values. A dependable decision combines flow, pressure and conductivity data corrected to the same reference conditions with stage pressure drop and pretreatment records. This guide explains how to identify fouling, distinguish deposit types, plan CIP and verify recovery.
How Can You Tell That an SWRO Membrane Is Fouled?
Fouling is indicated by persistent changes in water production, hydraulic resistance, energy demand and product-water quality. Raw flow or one pressure-gauge reading can be misleading, so the assessment should combine normalized performance trends, stage differential pressure, salt passage and feed-water conditions. The wider monitoring and control context used around Reinmeer equipment is presented on the seawater treatment technology and safety page.
Decline in normalized permeate flow
Permeate flow is the volume of product water passing through the membranes over a defined period. Warmer seawater has lower viscosity and may produce more flow, whereas colder water may reduce output even when the membrane is clean. Feed pressure, salinity, recovery and permeate-side backpressure also affect the measured value. Looking only at daily cubic metres can therefore confuse seasonal or operating changes with membrane fouling.
For a technical assessment, operating data are corrected to selected reference conditions for temperature, pressure, feed concentration and recovery. This normalization should be performed with the membrane manufacturer’s software or an approved performance model. If normalized permeate flow falls while higher feed pressure is needed to hold production, increasing hydraulic resistance on the membrane surface is a credible explanation. Pump efficiency, valve position, cartridge-filter loss, sensor drift and piping restrictions must still be checked before the loss is attributed to the membrane bank.
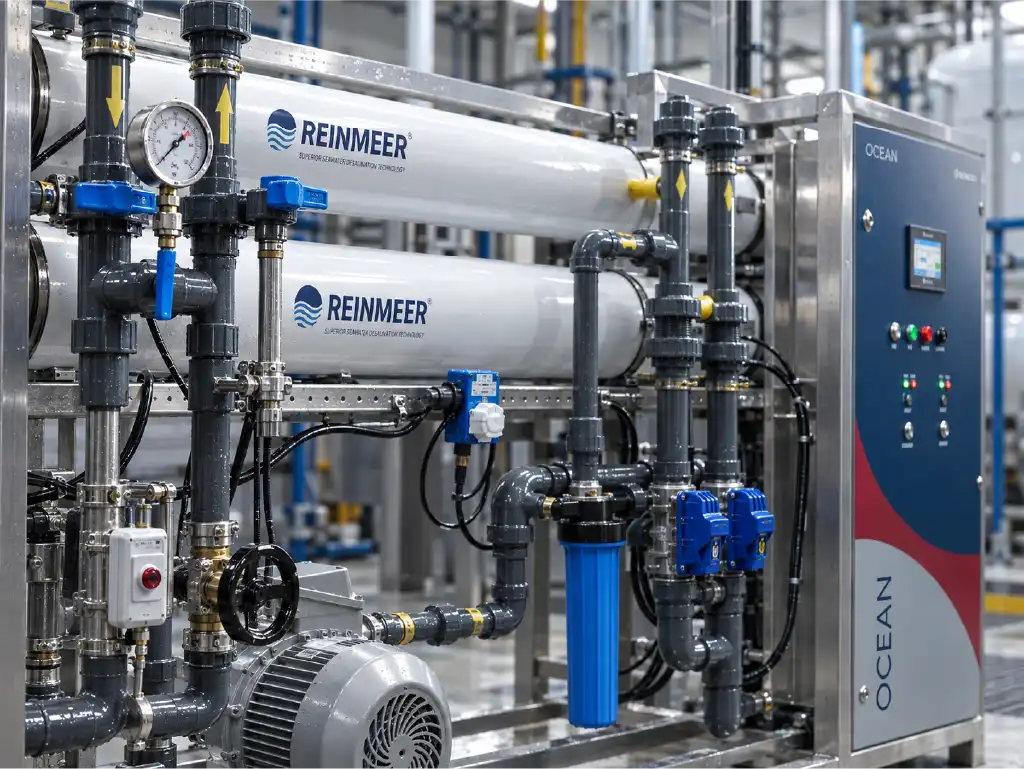
A useful record includes date and time, train and stage identification, feed, permeate and concentrate flows, conductivity or TDS for all streams, temperature, pH, feed and concentrate pressures, permeate backpressure and recovery. Take readings during stable operation and at a comparable load. Retain stabilized commissioning performance as the baseline, and mark dosing changes, unusual intake conditions, filter replacement, maintenance and calibration on the trend.
The current Hydranautics technical bulletin lists a 10% decrease in normalized permeate flow, a 10% change in normalized permeate quality and a 15% increase in normalized pressure drop as typical cleaning indicators under normal conditions. It also notes that heavy deposits can hinder chemical penetration and foulant removal. These figures are not universal limits to be copied into every plant. The installed element’s manufacturer cleaning bulletin, warranty conditions and project acceptance criteria take precedence.
| Monitored indicator | Typical trigger | Checks before CIP | Possible interpretation |
|---|---|---|---|
| Normalized permeate flow | About 10% below baseline | Temperature, pressure, salinity, recovery and flowmeter | Fouling, scaling or hydraulic restriction |
| Normalized pressure drop | About 15% above baseline | Stage readings, filters, valve position and sensor zero | Deposit or blockage in the feed channel |
| Normalized salt passage | About 10% above baseline | Conductivity cells, sample point and stable operation | Scaling, seal leakage or membrane damage |
Operators should look for several reliable readings moving in the same direction instead of reacting to a one-day deviation. Once confirmed, check instrumentation and operating conditions, followed by pretreatment and stage behavior. Do not delay cleaning after a credible trigger, but avoid unnecessary chemical exposure. Every CIP consumes chemicals, water, labor and production time; unsuitable pH, temperature or contact time can shorten membrane life.
Increase in differential pressure and salt passage
Differential pressure is the difference between the pressure at a stage inlet and the concentrate pressure at its outlet. Deposits narrow the feed channel, increase flow resistance and raise this difference. A train-level measurement is useful, but stage-level records provide better diagnostic value. A rapid rise at the lead stage may point toward colloidal or biological fouling, while a marked change near the tail stage may indicate scaling as salts become concentrated. This pattern guides investigation; it does not identify the foulant on its own.
Take pressure readings simultaneously, at stable flow and with verified sensors. If the feed pump, energy recovery device, concentrate valve or cartridge-filter loss has changed, isolate those effects. Raw differential pressure varies with flow, so variable-throughput plants should use manufacturer-compatible normalization. A transmitter range that is too wide may hide important changes; range selection, zero checks and calibration records belong in the CIP decision chain.
Salt passage is the ratio of salt concentration in the permeate to the relevant feed concentration and is usually trended using conductivity or laboratory TDS data. When permeate conductivity rises, verify temperature compensation, sample-line flushing, instrument calibration and sufficient time at steady state. Scaling can increase passage, but oxidant damage, out-of-range pH exposure, O-ring leakage, interconnector problems or physical membrane damage may create a similar deterioration in quality.
The decision must combine symptoms instead of relying on one number. Falling flow with a rapid first-stage pressure-drop increase strengthens the case for biological or colloidal deposition. If pressure drop and salt passage rise together near the tail stage, saturation calculations, antiscalant dosing and concentrate chemistry deserve attention. If salt passage rises while pressure drop remains nearly unchanged, seal integrity or membrane damage should be investigated. After corrective action, the same dataset should be collected again to test the diagnosis.
How Should CIP Cleaning Be Planned?
CIP should be planned as a controlled maintenance activity that identifies the likely foulant before selecting compatible chemistry and operating limits. The goal is not merely to raise flow for a short period; it is to remove deposits safely, protect rejection performance and reduce the cause of recurrence. For Reinmeer seawater reverse osmosis systems, capacity, pretreatment, automation and maintenance requirements are evaluated together according to project conditions.
Distinguishing scaling, organic and biological fouling
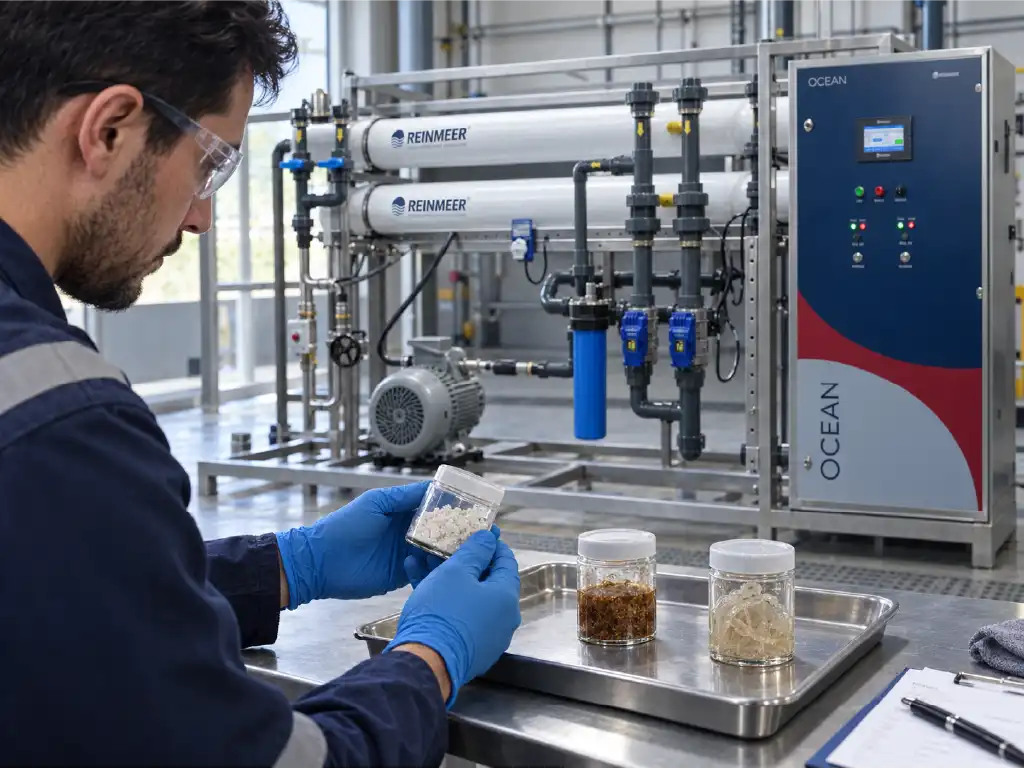
Scaling occurs when dissolved salts exceed their solubility limit and precipitate, often in the most concentrated part of the array. Organic fouling develops when natural organic matter or process-derived compounds adsorb to the membrane and form a gel or cake layer. Biological fouling consists of microorganisms and the sticky matrix they produce on wetted surfaces. Full-scale plants frequently contain mixed deposits, so selecting a chemical solely from residue color or one water test is unreliable.
| Fouling type | Typical location and trend | Useful evidence | Planning focus |
|---|---|---|---|
| Mineral scaling | Often the tail stage; rising salt passage and pressure drop | Ion analysis, saturation model, deposit analysis and dosing record | Manufacturer-approved low-pH or specialist cleaner |
| Organic fouling | Multiple stages; gradual normalized-flow decline | TOC trend, SDI/turbidity, filter and deposit inspection | Approved high-pH or detergent-based approach |
| Biological fouling | Often lead elements; marked differential-pressure rise | Microbial monitoring, ATP/HPC program and slime observation | Cleaning, compatible sanitation and source control |
| Mixed fouling | Different symptoms between stages | Deposit composition and cleaning-return analysis | Correct chemical sequence and stage-by-stage cleaning |
Pretreatment records provide essential context. Review intake turbidity and biological activity, coagulation, media-filter backwashing, ultrafiltration pressure where applicable, cartridge-filter replacement, SDI, oxidant control and antiscalant dosing. A scientific review indexed by the US Environmental Protection Agency on reverse-osmosis pretreatment technologies highlights how suitable pretreatment can limit organic, inorganic and particulate loads reaching RO membranes.
Cleaner selection must follow the membrane model’s permitted pH, temperature, concentration and exposure-time limits. Oxidant exposure can irreversibly damage many composite polyamide membranes. Acids and caustics must never be mixed, and the train must be thoroughly rinsed between incompatible steps according to the supplier’s procedure. Safety data sheets, personal protective equipment, ventilation, secondary containment and compliant disposal of spent solution are part of the work plan, not administrative details to be considered afterward.
A practical CIP work order can follow this sequence:
- Confirm the performance trend and verify the reliability of flow, pressure and conductivity instruments.
- Collect feed, permeate, concentrate and, where possible, deposit samples to identify the likely foulant source.
- Use the membrane manual to approve cleaner selection, sequence, pH and temperature limits, circulation flow and contact time.
- Safely isolate the train and perform a low-pressure pre-flush using suitable-quality RO permeate or deionized water.
- Prepare the solution under controlled conditions; clean stages separately where practical and record return pH, temperature, color, turbidity and conductivity.
- Rinse until chemical residuals meet the approved endpoint, manage waste through the authorized route and return the system to service gradually.
Expert Note: Two SWRO trains with the same nominal design may require different cleaning intervals because of intake design, seawater temperature, recovery, pretreatment and load profile. The most defensible interval comes from each train’s normalized performance curve, not from a generic calendar.
Verifying performance after cleaning
Do not accept performance from one reading taken immediately after CIP. Confirm cleaning-solution removal using pH, conductivity and specified drain or concentrate endpoints. Bring the train gradually to its normal operating point and divert permeate until it meets the intended-use quality requirements. Occupational safety, chemical handling and water-release procedures must follow site rules.
After stable operation is reached, collect the same dataset used before cleaning from the same instruments and sample points. If feed temperature, salinity or recovery has changed, normalize results back to the established reference. Cleaning success is demonstrated by the combined improvement in normalized flow, normalized pressure drop and normalized salt passage, not simply by a higher raw flow. Stage pressures, permeate conductivity, energy consumption and water production should also be trended, with the sampling time and stabilization period documented in the maintenance report.
Acceptance criteria are defined for the project and installed membrane model. The normal expectation is that normalized permeate flow approaches the clean baseline, differential pressure falls materially and salt passage does not deteriorate. Full recovery is not always possible: age, irreversible organic adsorption, compaction or chemical damage may create persistent loss. A report should therefore show baseline, pre-CIP and post-CIP values together with calculated recovery rather than state only that cleaning was successful.
If recovery is insufficient, do not immediately repeat a harsher cleaning. Investigate foulant diagnosis, circulation, temperature, solution strength, a blocked feed channel, chemical sequence, O-ring leakage or membrane damage. Element autopsy may be justified when the cause remains uncertain. Repeatedly shorter intervals indicate that pretreatment or operating setpoints need review.
A robust operating program makes cleaning triggers visible in SCADA or the maintenance-management system and closes every CIP with a comparable performance package. When project-specific Reinmeer desalination solutions are assessed, reviewing the complete process—from intake and pretreatment to the membrane train and energy recovery—helps address recurring fouling causes rather than treating only their symptoms.
Frequently Asked Questions
How often should SWRO membranes be cleaned?
No fixed number of months is correct for every plant. The interval should be based on trends in normalized permeate flow, differential pressure, salt passage and pretreatment data. A calendar can support outage planning, but measured performance should control the decision.
Should CIP start as soon as permeate flow decreases?
Not automatically. Check seawater temperature, feed pressure and salinity, recovery, permeate backpressure, filter losses and flowmeter accuracy first. Plan cleaning when the decline remains in normalized data and is supported by other credible fouling indicators.
Can high differential pressure damage a membrane element?
Prolonged or excessive pressure drop can indicate severe feed-channel blockage and may create mechanical risk for the element. Confirm stage and pressure-vessel limits in the current membrane documentation and clean before deposits become heavy.
How can scaling be distinguished from biofouling?
Location and trend are useful clues: scaling often becomes more visible at the tail stage, while biological fouling commonly affects lead elements. Ion and saturation analysis, microbial tests, deposit characterization and pretreatment records are needed for a stronger diagnosis.
Why might performance fail to recover completely after CIP?
The deposit may be severe, the chemical or sequence may be unsuitable, the feed channel may be plugged, or irreversible adsorption, compaction or damage may exist. Instrument error and leakage at O-rings or interconnectors can also make recovery appear poor.
Can plant personnel select the CIP chemical themselves?
Selection should not rely only on a generic foulant category. Verify the membrane manufacturer’s instructions, material compatibility, deposit evidence, safety data and waste requirements. Support from the system supplier, membrane manufacturer or water-chemistry specialist may be appropriate.
Evaluate SWRO Performance with Traceable Data
Recurring flow loss, rising energy demand or increasing permeate conductivity may reflect more than a cleaning issue; each can point to pretreatment, operating setpoints, instrumentation or membrane selection. Reinmeer Water Treatment Systems supports project-based review of operating records, site conditions, capacity requirements, target water quality and maintenance strategy.
A sound SWRO membrane CIP program establishes a clean baseline, validates critical measurements, distinguishes probable foulants and defines post-cleaning acceptance criteria before chemicals are circulated. This makes decisions easier to audit and allows one cleaning cycle to be compared with the next. To discuss performance loss in an existing plant, arrange a technical site assessment or request a project proposal, contact the Reinmeer engineering team. Providing recent feed-water analysis, capacity, operating hours, chemical dosing and normalized trend records will support a more useful initial evaluation.
The images are for illustrative purposes and feature artificial intelligence capabilities.